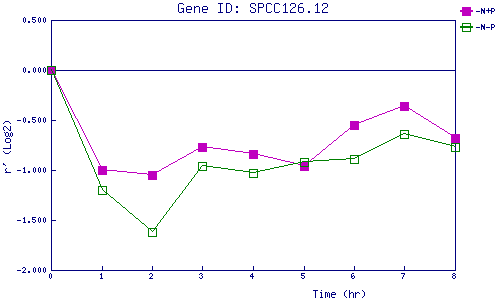
| 0 | 1 | 2 | 3 | 4 | 5 | 6 | 7 | 8 | |
| -N+P | 0.000 | -1.005 | -1.046 | -0.769 | -0.845 | -0.956 | -0.554 | -0.358 | -0.681 |
| -N-P | 0.000 | -1.198 | -1.621 | -0.964 | -1.032 | -0.922 | -0.890 | -0.642 | -0.772 |
|
-N+P: Nitrogen starved in the presence of P-factor -N-P: Nitrogen starved in the absence of P-factor |