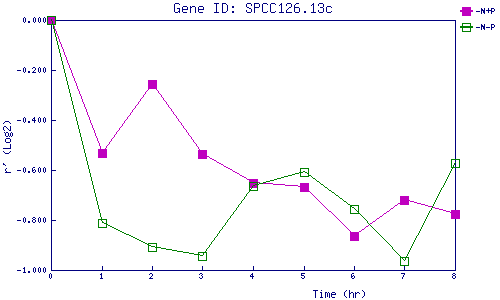
| 0 | 1 | 2 | 3 | 4 | 5 | 6 | 7 | 8 | |
| -N+P | 0.000 | -0.533 | -0.255 | -0.536 | -0.653 | -0.667 | -0.865 | -0.719 | -0.777 |
| -N-P | 0.000 | -0.811 | -0.909 | -0.942 | -0.666 | -0.608 | -0.756 | -0.964 | -0.571 |
|
-N+P: Nitrogen starved in the presence of P-factor -N-P: Nitrogen starved in the absence of P-factor |