prp18
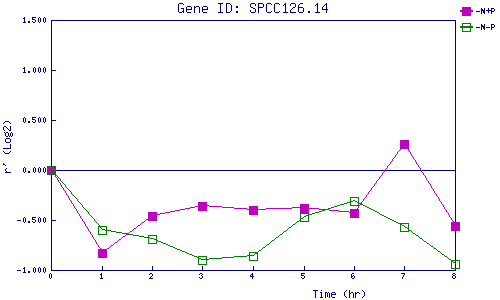
| 0 | 1 | 2 | 3 | 4 | 5 | 6 | 7 | 8 | |
| -N+P | 0.000 | -0.828 | -0.462 | -0.360 | -0.400 | -0.376 | -0.430 | 0.255 | -0.557 |
| -N-P | 0.000 | -0.602 | -0.693 | -0.896 | -0.864 | -0.471 | -0.307 | -0.569 | -0.942 |
|
-N+P: Nitrogen starved in the presence of P-factor -N-P: Nitrogen starved in the absence of P-factor |