sec65
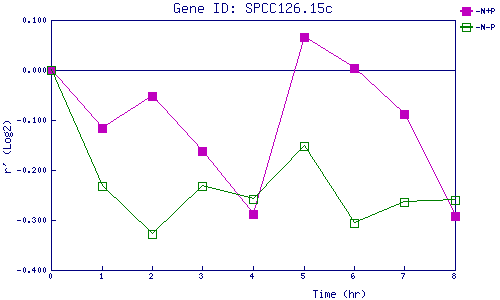
| 0 | 1 | 2 | 3 | 4 | 5 | 6 | 7 | 8 | |
| -N+P | 0.000 | -0.117 | -0.053 | -0.162 | -0.289 | 0.066 | 0.003 | -0.088 | -0.293 |
| -N-P | 0.000 | -0.233 | -0.328 | -0.232 | -0.258 | -0.153 | -0.306 | -0.265 | -0.260 |
|
-N+P: Nitrogen starved in the presence of P-factor -N-P: Nitrogen starved in the absence of P-factor |