spf30
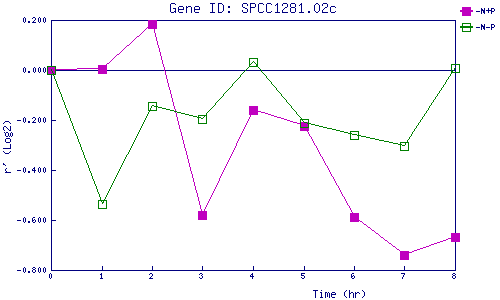
| 0 | 1 | 2 | 3 | 4 | 5 | 6 | 7 | 8 | |
| -N+P | 0.000 | 0.003 | 0.183 | -0.580 | -0.159 | -0.222 | -0.588 | -0.739 | -0.668 |
| -N-P | 0.000 | -0.534 | -0.145 | -0.197 | 0.033 | -0.211 | -0.260 | -0.305 | 0.010 |
|
-N+P: Nitrogen starved in the presence of P-factor -N-P: Nitrogen starved in the absence of P-factor |