| 0 | 1 | 2 | 3 | 4 | 5 | 6 | 7 | 8 | |
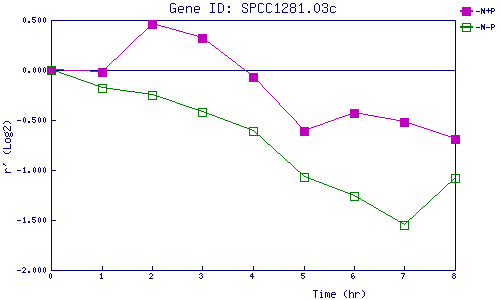
| -N+P | 0.000 | -0.024 | 0.461 | 0.316 | -0.071 | -0.614 | -0.431 | -0.521 | -0.690 |
| -N-P | 0.000 | -0.181 | -0.250 | -0.420 | -0.608 | -1.074 | -1.256 | -1.552 | -1.077 |
|
-N+P: Nitrogen starved in the presence of P-factor -N-P: Nitrogen starved in the absence of P-factor |