wtf11 meu24
| 0 | 1 | 2 | 3 | 4 | 5 | 6 | 7 | 8 | |
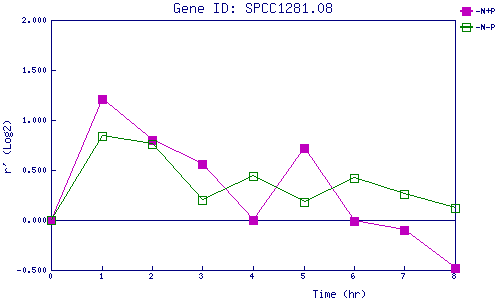
| -N+P | 0.000 | 1.208 | 0.798 | 0.561 | -0.003 | 0.716 | -0.009 | -0.101 | -0.483 |
| -N-P | 0.000 | 0.839 | 0.756 | 0.203 | 0.435 | 0.185 | 0.416 | 0.265 | 0.123 |
|
-N+P: Nitrogen starved in the presence of P-factor -N-P: Nitrogen starved in the absence of P-factor |
