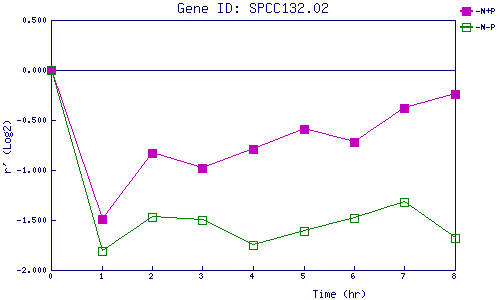
| 0 | 1 | 2 | 3 | 4 | 5 | 6 | 7 | 8 | |
| -N+P | 0.000 | -1.490 | -0.826 | -0.976 | -0.789 | -0.588 | -0.718 | -0.378 | -0.235 |
| -N-P | 0.000 | -1.809 | -1.474 | -1.502 | -1.749 | -1.611 | -1.478 | -1.323 | -1.680 |
|
-N+P: Nitrogen starved in the presence of P-factor -N-P: Nitrogen starved in the absence of P-factor |