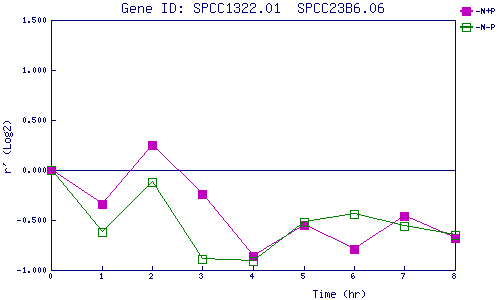
| 0 | 1 | 2 | 3 | 4 | 5 | 6 | 7 | 8 | |
| -N+P | 0.000 | -0.340 | 0.253 | -0.240 | -0.859 | -0.549 | -0.793 | -0.460 | -0.681 |
| -N-P | 0.000 | -0.624 | -0.118 | -0.889 | -0.907 | -0.517 | -0.440 | -0.560 | -0.649 |
|
-N+P: Nitrogen starved in the presence of P-factor -N-P: Nitrogen starved in the absence of P-factor |