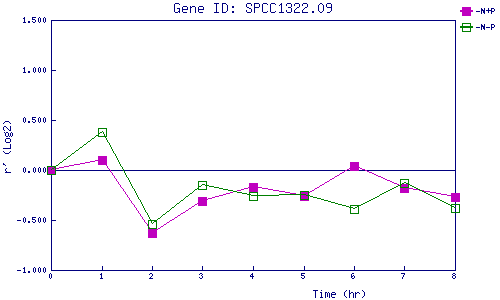
| 0 | 1 | 2 | 3 | 4 | 5 | 6 | 7 | 8 | |
| -N+P | 0.000 | 0.100 | -0.633 | -0.309 | -0.174 | -0.258 | 0.040 | -0.182 | -0.268 |
| -N-P | 0.000 | 0.384 | -0.542 | -0.147 | -0.259 | -0.254 | -0.392 | -0.127 | -0.385 |
|
-N+P: Nitrogen starved in the presence of P-factor -N-P: Nitrogen starved in the absence of P-factor |