bub1
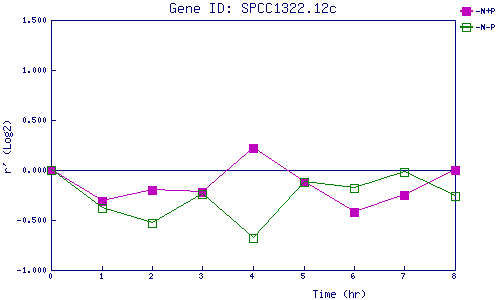
| 0 | 1 | 2 | 3 | 4 | 5 | 6 | 7 | 8 | |
| -N+P | 0.000 | -0.309 | -0.205 | -0.222 | 0.216 | -0.120 | -0.424 | -0.248 | 0.000 |
| -N-P | 0.000 | -0.382 | -0.531 | -0.239 | -0.683 | -0.119 | -0.179 | -0.020 | -0.257 |
|
-N+P: Nitrogen starved in the presence of P-factor -N-P: Nitrogen starved in the absence of P-factor |