ade6 min1
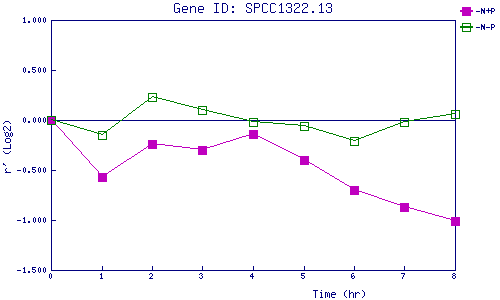
| 0 | 1 | 2 | 3 | 4 | 5 | 6 | 7 | 8 | |
| -N+P | 0.000 | -0.570 | -0.237 | -0.299 | -0.144 | -0.404 | -0.702 | -0.873 | -1.011 |
| -N-P | 0.000 | -0.149 | 0.230 | 0.102 | -0.022 | -0.056 | -0.206 | -0.018 | 0.065 |
|
-N+P: Nitrogen starved in the presence of P-factor -N-P: Nitrogen starved in the absence of P-factor |