rpl34-2 rpl3402
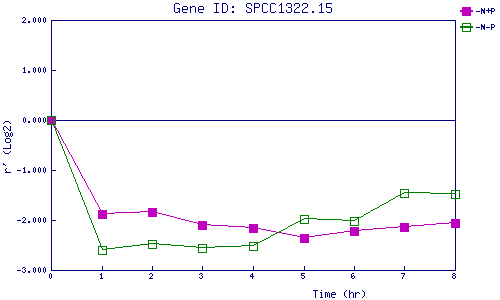
| 0 | 1 | 2 | 3 | 4 | 5 | 6 | 7 | 8 | |
| -N+P | 0.000 | -1.882 | -1.849 | -2.105 | -2.160 | -2.356 | -2.217 | -2.139 | -2.058 |
| -N-P | 0.000 | -2.595 | -2.481 | -2.562 | -2.527 | -1.983 | -2.017 | -1.457 | -1.483 |
|
-N+P: Nitrogen starved in the presence of P-factor -N-P: Nitrogen starved in the absence of P-factor |