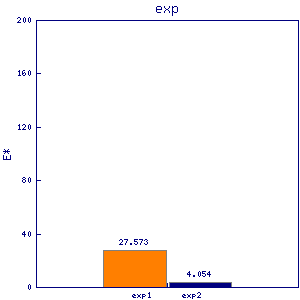
pma2
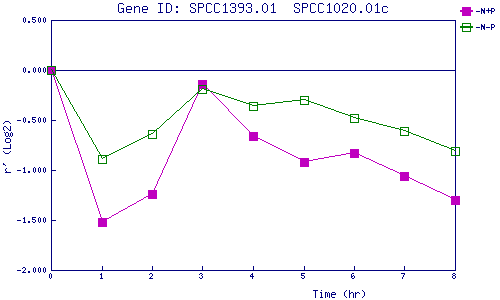
| 0 | 1 | 2 | 3 | 4 | 5 | 6 | 7 | 8 | |
| -N+P | 0.000 | -1.515 | -1.237 | -0.137 | -0.656 | -0.915 | -0.829 | -1.058 | -1.305 |
| -N-P | 0.000 | -0.886 | -0.635 | -0.190 | -0.360 | -0.304 | -0.482 | -0.611 | -0.814 |
|
-N+P: Nitrogen starved in the presence of P-factor -N-P: Nitrogen starved in the absence of P-factor |