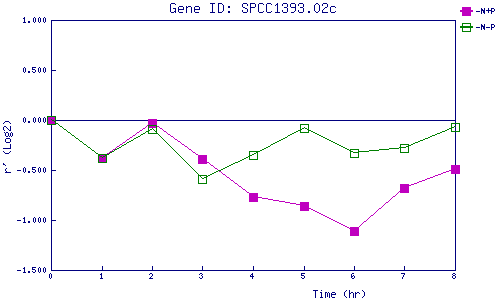
| 0 | 1 | 2 | 3 | 4 | 5 | 6 | 7 | 8 | |
| -N+P | 0.000 | -0.383 | -0.034 | -0.390 | -0.772 | -0.857 | -1.109 | -0.683 | -0.487 |
| -N-P | 0.000 | -0.376 | -0.091 | -0.586 | -0.350 | -0.078 | -0.329 | -0.283 | -0.073 |
|
-N+P: Nitrogen starved in the presence of P-factor -N-P: Nitrogen starved in the absence of P-factor |