rps15-1 rps1501
| 0 | 1 | 2 | 3 | 4 | 5 | 6 | 7 | 8 | |
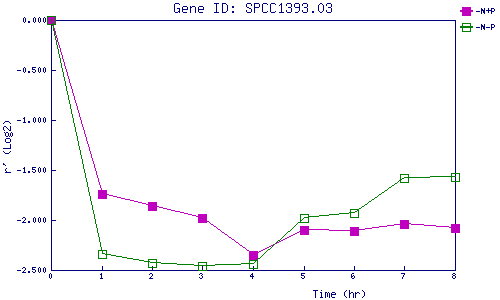
| -N+P | 0.000 | -1.740 | -1.860 | -1.981 | -2.346 | -2.104 | -2.108 | -2.045 | -2.082 |
| -N-P | 0.000 | -2.342 | -2.426 | -2.455 | -2.437 | -1.979 | -1.927 | -1.584 | -1.573 |
|
-N+P: Nitrogen starved in the presence of P-factor -N-P: Nitrogen starved in the absence of P-factor |
