| 0 | 1 | 2 | 3 | 4 | 5 | 6 | 7 | 8 | |
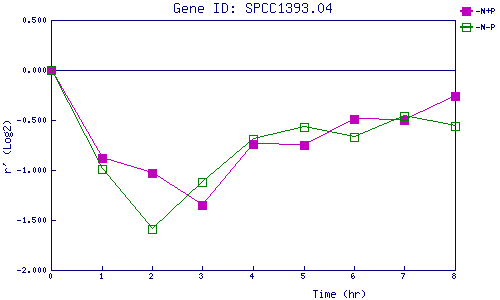
| -N+P | 0.000 | -0.880 | -1.028 | -1.353 | -0.736 | -0.754 | -0.491 | -0.501 | -0.263 |
| -N-P | 0.000 | -0.986 | -1.593 | -1.123 | -0.690 | -0.567 | -0.674 | -0.458 | -0.555 |
|
-N+P: Nitrogen starved in the presence of P-factor -N-P: Nitrogen starved in the absence of P-factor |