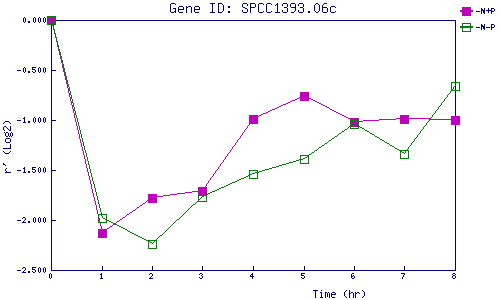
| 0 | 1 | 2 | 3 | 4 | 5 | 6 | 7 | 8 | |
| -N+P | 0.000 | -2.127 | -1.783 | -1.711 | -0.991 | -0.763 | -1.024 | -0.991 | -0.999 |
| -N-P | 0.000 | -1.982 | -2.245 | -1.774 | -1.535 | -1.391 | -1.044 | -1.344 | -0.660 |
|
-N+P: Nitrogen starved in the presence of P-factor -N-P: Nitrogen starved in the absence of P-factor |