| 0 | 1 | 2 | 3 | 4 | 5 | 6 | 7 | 8 | |
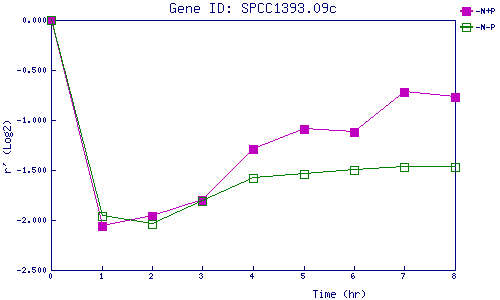
| -N+P | 0.000 | -2.062 | -1.956 | -1.800 | -1.293 | -1.090 | -1.124 | -0.721 | -0.774 |
| -N-P | 0.000 | -1.958 | -2.045 | -1.814 | -1.578 | -1.541 | -1.501 | -1.473 | -1.467 |
|
-N+P: Nitrogen starved in the presence of P-factor -N-P: Nitrogen starved in the absence of P-factor |