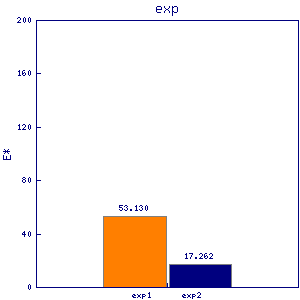
ctr4
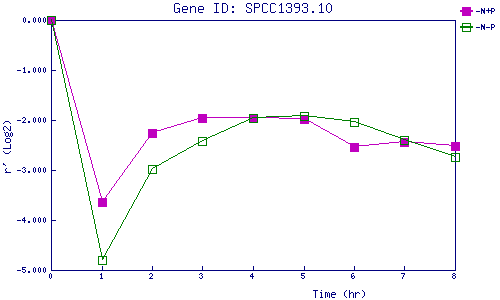
| 0 | 1 | 2 | 3 | 4 | 5 | 6 | 7 | 8 | |
| -N+P | 0.000 | -3.643 | -2.256 | -1.959 | -1.954 | -1.971 | -2.534 | -2.442 | -2.526 |
| -N-P | 0.000 | -4.804 | -2.985 | -2.412 | -1.956 | -1.919 | -2.042 | -2.407 | -2.747 |
|
-N+P: Nitrogen starved in the presence of P-factor -N-P: Nitrogen starved in the absence of P-factor |