| 0 | 1 | 2 | 3 | 4 | 5 | 6 | 7 | 8 | |
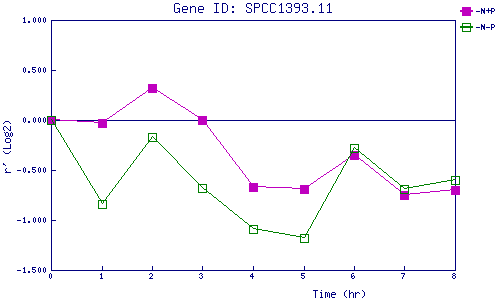
| -N+P | 0.000 | -0.034 | 0.322 | 0.002 | -0.666 | -0.689 | -0.349 | -0.746 | -0.700 |
| -N-P | 0.000 | -0.838 | -0.173 | -0.677 | -1.093 | -1.177 | -0.278 | -0.690 | -0.603 |
|
-N+P: Nitrogen starved in the presence of P-factor -N-P: Nitrogen starved in the absence of P-factor |
