adh1 adh
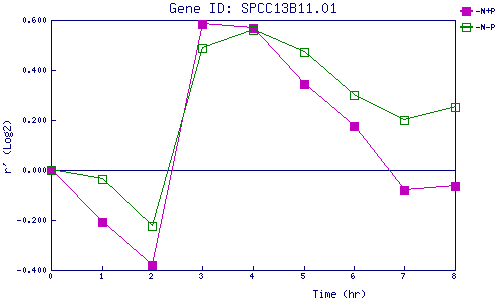
| 0 | 1 | 2 | 3 | 4 | 5 | 6 | 7 | 8 | |
| -N+P | 0.000 | -0.209 | -0.381 | 0.584 | 0.567 | 0.342 | 0.178 | -0.081 | -0.064 |
| -N-P | 0.000 | -0.036 | -0.222 | 0.490 | 0.560 | 0.474 | 0.301 | 0.201 | 0.251 |
|
-N+P: Nitrogen starved in the presence of P-factor -N-P: Nitrogen starved in the absence of P-factor |