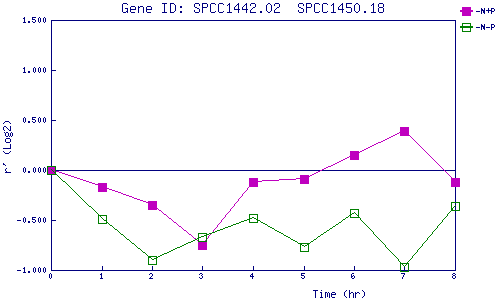
| 0 | 1 | 2 | 3 | 4 | 5 | 6 | 7 | 8 | |
| -N+P | 0.000 | -0.174 | -0.354 | -0.747 | -0.119 | -0.094 | 0.151 | 0.386 | -0.115 |
| -N-P | 0.000 | -0.492 | -0.903 | -0.666 | -0.481 | -0.772 | -0.427 | -0.969 | -0.363 |
|
-N+P: Nitrogen starved in the presence of P-factor -N-P: Nitrogen starved in the absence of P-factor |