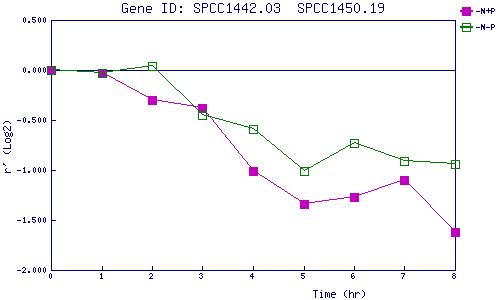
| 0 | 1 | 2 | 3 | 4 | 5 | 6 | 7 | 8 | |
| -N+P | 0.000 | -0.034 | -0.304 | -0.379 | -1.012 | -1.344 | -1.268 | -1.095 | -1.615 |
| -N-P | 0.000 | -0.029 | 0.042 | -0.451 | -0.590 | -1.014 | -0.730 | -0.912 | -0.942 |
|
-N+P: Nitrogen starved in the presence of P-factor -N-P: Nitrogen starved in the absence of P-factor |