trp3
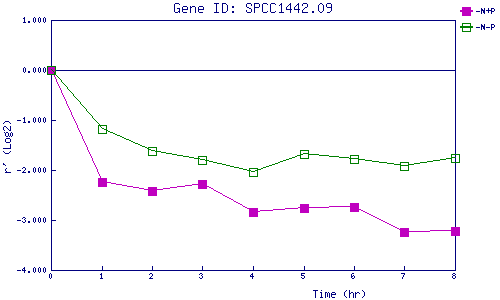
| 0 | 1 | 2 | 3 | 4 | 5 | 6 | 7 | 8 | |
| -N+P | 0.000 | -2.234 | -2.426 | -2.290 | -2.843 | -2.764 | -2.741 | -3.236 | -3.211 |
| -N-P | 0.000 | -1.185 | -1.611 | -1.794 | -2.045 | -1.682 | -1.783 | -1.916 | -1.752 |
|
-N+P: Nitrogen starved in the presence of P-factor -N-P: Nitrogen starved in the absence of P-factor |