rpb3
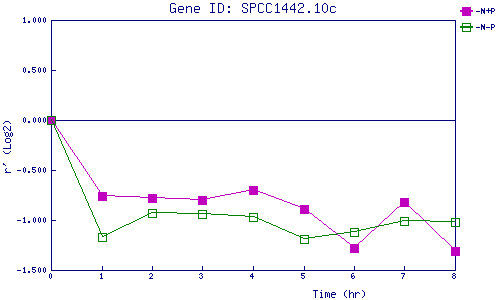
| 0 | 1 | 2 | 3 | 4 | 5 | 6 | 7 | 8 | |
| -N+P | 0.000 | -0.755 | -0.780 | -0.803 | -0.697 | -0.887 | -1.285 | -0.818 | -1.309 |
| -N-P | 0.000 | -1.171 | -0.930 | -0.943 | -0.969 | -1.193 | -1.124 | -1.007 | -1.020 |
|
-N+P: Nitrogen starved in the presence of P-factor -N-P: Nitrogen starved in the absence of P-factor |