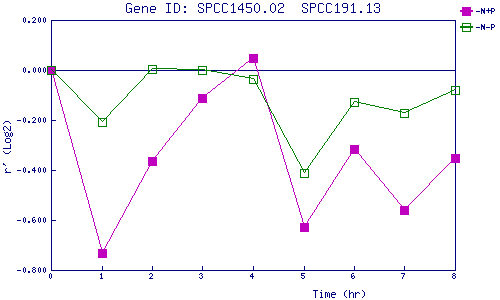
| 0 | 1 | 2 | 3 | 4 | 5 | 6 | 7 | 8 | |
| -N+P | 0.000 | -0.733 | -0.365 | -0.110 | 0.050 | -0.627 | -0.316 | -0.562 | -0.351 |
| -N-P | 0.000 | -0.206 | 0.003 | 0.002 | -0.036 | -0.411 | -0.126 | -0.171 | -0.078 |
|
-N+P: Nitrogen starved in the presence of P-factor -N-P: Nitrogen starved in the absence of P-factor |