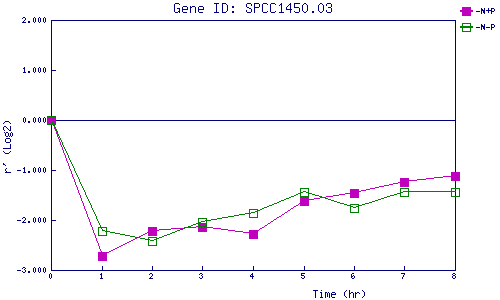
| 0 | 1 | 2 | 3 | 4 | 5 | 6 | 7 | 8 | |
| -N+P | 0.000 | -2.716 | -2.219 | -2.149 | -2.281 | -1.611 | -1.465 | -1.241 | -1.130 |
| -N-P | 0.000 | -2.211 | -2.418 | -2.032 | -1.863 | -1.445 | -1.767 | -1.448 | -1.447 |
|
-N+P: Nitrogen starved in the presence of P-factor -N-P: Nitrogen starved in the absence of P-factor |