tef5
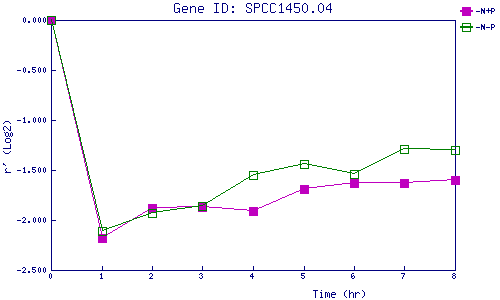
| 0 | 1 | 2 | 3 | 4 | 5 | 6 | 7 | 8 | |
| -N+P | 0.000 | -2.180 | -1.875 | -1.873 | -1.907 | -1.692 | -1.634 | -1.631 | -1.600 |
| -N-P | 0.000 | -2.108 | -1.932 | -1.855 | -1.552 | -1.440 | -1.538 | -1.290 | -1.303 |
|
-N+P: Nitrogen starved in the presence of P-factor -N-P: Nitrogen starved in the absence of P-factor |