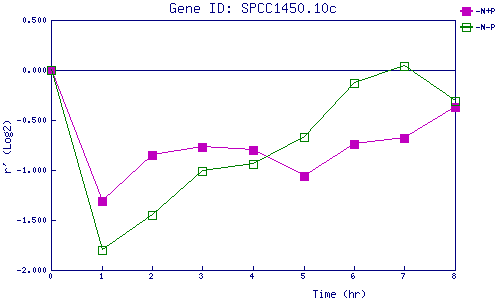
| 0 | 1 | 2 | 3 | 4 | 5 | 6 | 7 | 8 | |
| -N+P | 0.000 | -1.313 | -0.849 | -0.770 | -0.799 | -1.062 | -0.738 | -0.680 | -0.373 |
| -N-P | 0.000 | -1.796 | -1.452 | -1.013 | -0.941 | -0.671 | -0.127 | 0.045 | -0.308 |
|
-N+P: Nitrogen starved in the presence of P-factor -N-P: Nitrogen starved in the absence of P-factor |