| 0 | 1 | 2 | 3 | 4 | 5 | 6 | 7 | 8 | |
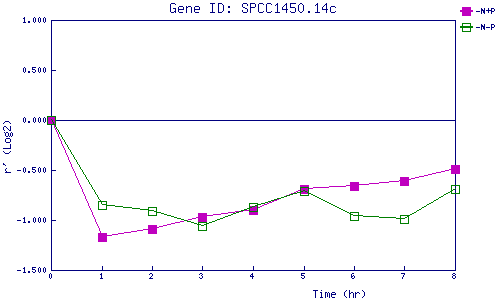
| -N+P | 0.000 | -1.173 | -1.088 | -0.974 | -0.897 | -0.688 | -0.660 | -0.609 | -0.494 |
| -N-P | 0.000 | -0.854 | -0.913 | -1.058 | -0.872 | -0.712 | -0.959 | -0.992 | -0.687 |
|
-N+P: Nitrogen starved in the presence of P-factor -N-P: Nitrogen starved in the absence of P-factor |