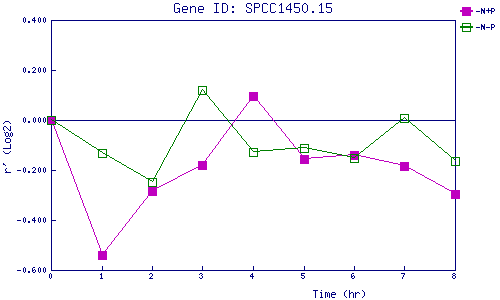
| 0 | 1 | 2 | 3 | 4 | 5 | 6 | 7 | 8 | |
| -N+P | 0.000 | -0.539 | -0.284 | -0.181 | 0.095 | -0.155 | -0.140 | -0.183 | -0.295 |
| -N-P | 0.000 | -0.133 | -0.250 | 0.120 | -0.126 | -0.113 | -0.151 | 0.010 | -0.165 |
|
-N+P: Nitrogen starved in the presence of P-factor -N-P: Nitrogen starved in the absence of P-factor |