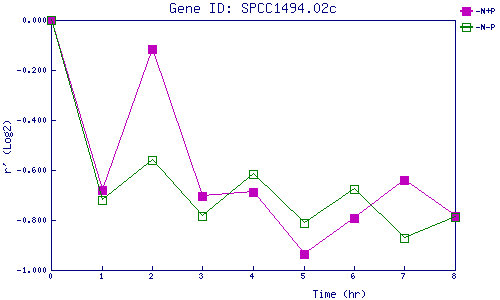
| 0 | 1 | 2 | 3 | 4 | 5 | 6 | 7 | 8 | |
| -N+P | 0.000 | -0.679 | -0.116 | -0.705 | -0.687 | -0.937 | -0.790 | -0.641 | -0.784 |
| -N-P | 0.000 | -0.719 | -0.561 | -0.784 | -0.616 | -0.811 | -0.677 | -0.870 | -0.787 |
|
-N+P: Nitrogen starved in the presence of P-factor -N-P: Nitrogen starved in the absence of P-factor |