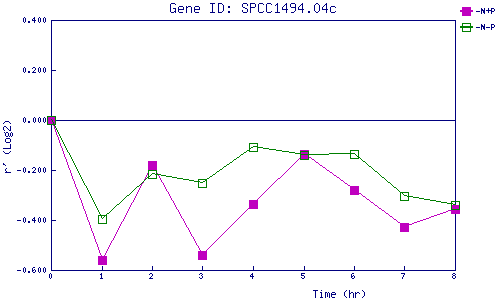
| 0 | 1 | 2 | 3 | 4 | 5 | 6 | 7 | 8 | |
| -N+P | 0.000 | -0.561 | -0.179 | -0.541 | -0.336 | -0.138 | -0.282 | -0.427 | -0.356 |
| -N-P | 0.000 | -0.396 | -0.216 | -0.253 | -0.109 | -0.140 | -0.138 | -0.304 | -0.339 |
|
-N+P: Nitrogen starved in the presence of P-factor -N-P: Nitrogen starved in the absence of P-factor |