reserved_name_ubp12
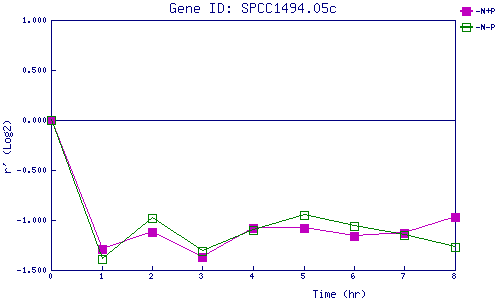
| 0 | 1 | 2 | 3 | 4 | 5 | 6 | 7 | 8 | |
| -N+P | 0.000 | -1.290 | -1.121 | -1.367 | -1.081 | -1.078 | -1.165 | -1.134 | -0.972 |
| -N-P | 0.000 | -1.392 | -0.980 | -1.311 | -1.105 | -0.954 | -1.060 | -1.150 | -1.274 |
|
-N+P: Nitrogen starved in the presence of P-factor -N-P: Nitrogen starved in the absence of P-factor |