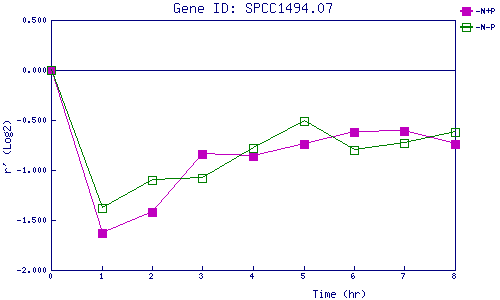
| 0 | 1 | 2 | 3 | 4 | 5 | 6 | 7 | 8 | |
| -N+P | 0.000 | -1.626 | -1.423 | -0.844 | -0.863 | -0.741 | -0.623 | -0.608 | -0.736 |
| -N-P | 0.000 | -1.376 | -1.095 | -1.083 | -0.783 | -0.510 | -0.798 | -0.733 | -0.625 |
|
-N+P: Nitrogen starved in the presence of P-factor -N-P: Nitrogen starved in the absence of P-factor |