Tf2-13-pseudo
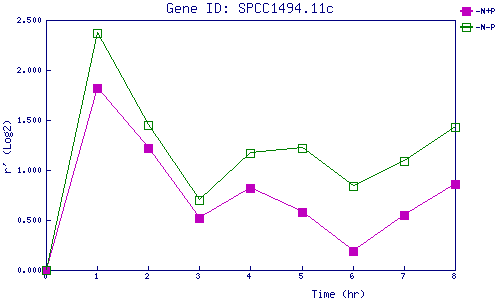
| 0 | 1 | 2 | 3 | 4 | 5 | 6 | 7 | 8 | |
| -N+P | 0.000 | 1.817 | 1.225 | 0.516 | 0.823 | 0.580 | 0.191 | 0.554 | 0.858 |
| -N-P | 0.000 | 2.368 | 1.450 | 0.696 | 1.167 | 1.220 | 0.843 | 1.093 | 1.427 |
|
-N+P: Nitrogen starved in the presence of P-factor -N-P: Nitrogen starved in the absence of P-factor |