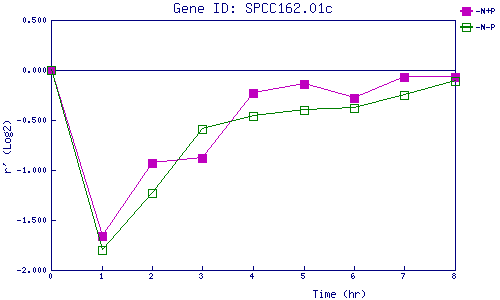
| 0 | 1 | 2 | 3 | 4 | 5 | 6 | 7 | 8 | |
| -N+P | 0.000 | -1.665 | -0.927 | -0.881 | -0.233 | -0.144 | -0.280 | -0.070 | -0.072 |
| -N-P | 0.000 | -1.798 | -1.226 | -0.587 | -0.455 | -0.396 | -0.385 | -0.252 | -0.110 |
|
-N+P: Nitrogen starved in the presence of P-factor -N-P: Nitrogen starved in the absence of P-factor |