wtf12 wtf13
| 0 | 1 | 2 | 3 | 4 | 5 | 6 | 7 | 8 | |
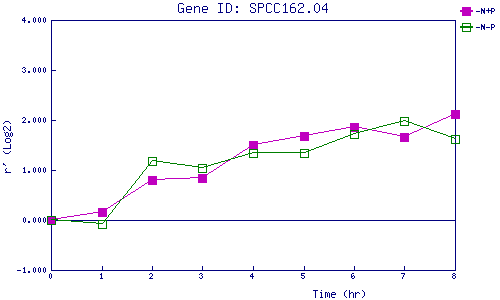
| -N+P | 0.000 | 0.168 | 0.804 | 0.844 | 1.491 | 1.680 | 1.857 | 1.664 | 2.129 |
| -N-P | 0.000 | -0.082 | 1.181 | 1.045 | 1.333 | 1.346 | 1.722 | 1.984 | 1.619 |
|
-N+P: Nitrogen starved in the presence of P-factor -N-P: Nitrogen starved in the absence of P-factor |
