coq3 wtf13
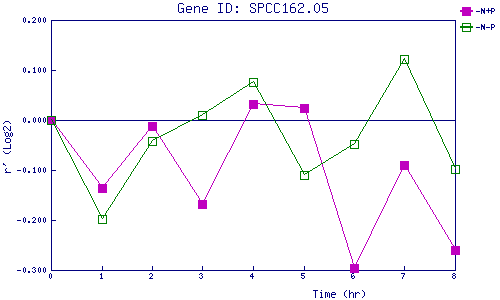
| 0 | 1 | 2 | 3 | 4 | 5 | 6 | 7 | 8 | |
| -N+P | 0.000 | -0.135 | -0.012 | -0.169 | 0.032 | 0.025 | -0.297 | -0.090 | -0.260 |
| -N-P | 0.000 | -0.198 | -0.042 | 0.010 | 0.075 | -0.110 | -0.049 | 0.122 | -0.098 |
|
-N+P: Nitrogen starved in the presence of P-factor -N-P: Nitrogen starved in the absence of P-factor |