hmg1
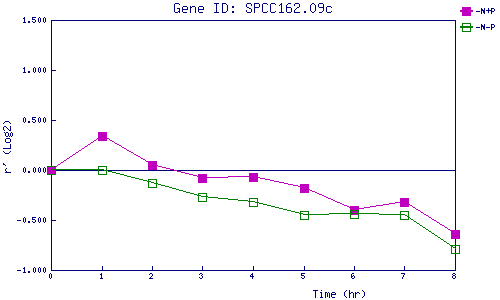
| 0 | 1 | 2 | 3 | 4 | 5 | 6 | 7 | 8 | |
| -N+P | 0.000 | 0.336 | 0.050 | -0.080 | -0.069 | -0.185 | -0.403 | -0.316 | -0.635 |
| -N-P | 0.000 | -0.005 | -0.131 | -0.269 | -0.323 | -0.453 | -0.437 | -0.451 | -0.791 |
|
-N+P: Nitrogen starved in the presence of P-factor -N-P: Nitrogen starved in the absence of P-factor |