lsm2
| 0 | 1 | 2 | 3 | 4 | 5 | 6 | 7 | 8 | |
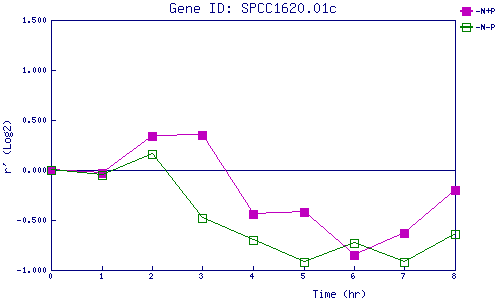
| -N+P | 0.000 | -0.030 | 0.343 | 0.354 | -0.438 | -0.419 | -0.846 | -0.633 | -0.205 |
| -N-P | 0.000 | -0.051 | 0.160 | -0.480 | -0.695 | -0.919 | -0.730 | -0.915 | -0.637 |
|
-N+P: Nitrogen starved in the presence of P-factor -N-P: Nitrogen starved in the absence of P-factor |
