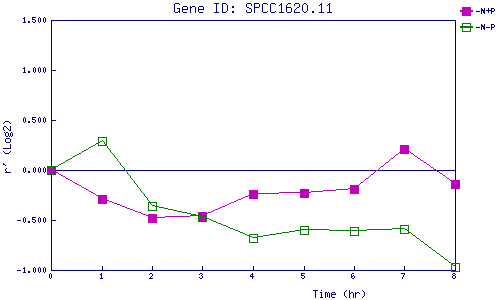
| 0 | 1 | 2 | 3 | 4 | 5 | 6 | 7 | 8 | |
| -N+P | 0.000 | -0.287 | -0.480 | -0.459 | -0.238 | -0.231 | -0.194 | 0.210 | -0.144 |
| -N-P | 0.000 | 0.290 | -0.363 | -0.466 | -0.679 | -0.600 | -0.612 | -0.588 | -0.972 |
|
-N+P: Nitrogen starved in the presence of P-factor -N-P: Nitrogen starved in the absence of P-factor |