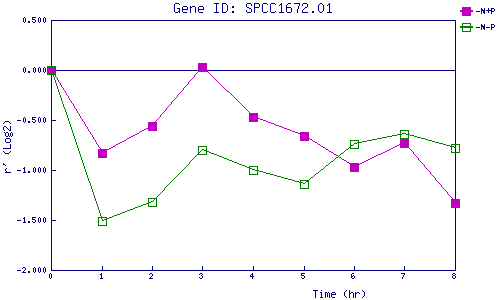
| 0 | 1 | 2 | 3 | 4 | 5 | 6 | 7 | 8 | |
| -N+P | 0.000 | -0.829 | -0.559 | 0.029 | -0.472 | -0.660 | -0.972 | -0.733 | -1.326 |
| -N-P | 0.000 | -1.510 | -1.315 | -0.803 | -1.004 | -1.139 | -0.740 | -0.636 | -0.782 |
|
-N+P: Nitrogen starved in the presence of P-factor -N-P: Nitrogen starved in the absence of P-factor |