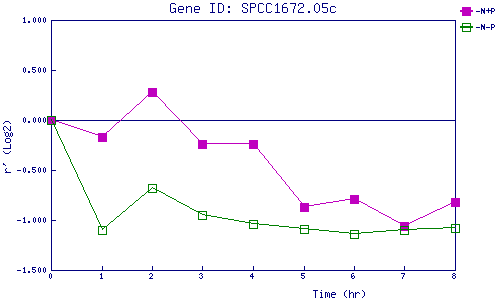
| 0 | 1 | 2 | 3 | 4 | 5 | 6 | 7 | 8 | |
| -N+P | 0.000 | -0.174 | 0.284 | -0.236 | -0.242 | -0.867 | -0.792 | -1.058 | -0.823 |
| -N-P | 0.000 | -1.102 | -0.675 | -0.948 | -1.036 | -1.091 | -1.145 | -1.095 | -1.077 |
|
-N+P: Nitrogen starved in the presence of P-factor -N-P: Nitrogen starved in the absence of P-factor |