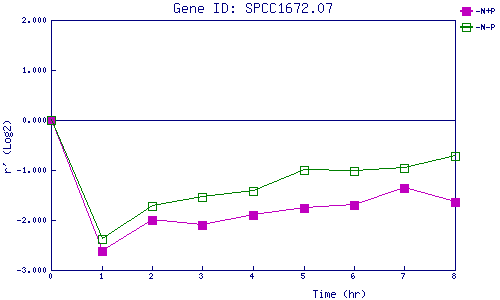
| 0 | 1 | 2 | 3 | 4 | 5 | 6 | 7 | 8 | |
| -N+P | 0.000 | -2.613 | -1.995 | -2.108 | -1.909 | -1.768 | -1.695 | -1.354 | -1.640 |
| -N-P | 0.000 | -2.386 | -1.715 | -1.535 | -1.429 | -0.995 | -1.025 | -0.962 | -0.714 |
|
-N+P: Nitrogen starved in the presence of P-factor -N-P: Nitrogen starved in the absence of P-factor |