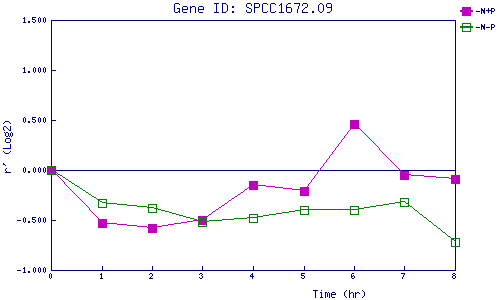
| 0 | 1 | 2 | 3 | 4 | 5 | 6 | 7 | 8 | |
| -N+P | 0.000 | -0.529 | -0.583 | -0.502 | -0.148 | -0.210 | 0.455 | -0.046 | -0.094 |
| -N-P | 0.000 | -0.334 | -0.382 | -0.523 | -0.480 | -0.396 | -0.396 | -0.325 | -0.724 |
|
-N+P: Nitrogen starved in the presence of P-factor -N-P: Nitrogen starved in the absence of P-factor |