| 0 | 1 | 2 | 3 | 4 | 5 | 6 | 7 | 8 | |
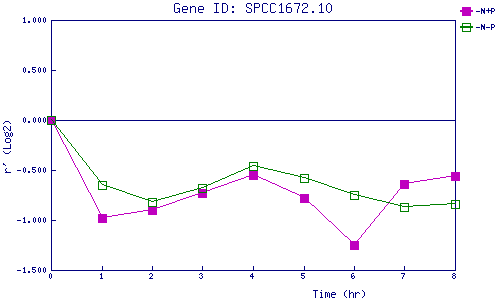
| -N+P | 0.000 | -0.976 | -0.902 | -0.726 | -0.551 | -0.784 | -1.250 | -0.641 | -0.555 |
| -N-P | 0.000 | -0.651 | -0.819 | -0.682 | -0.463 | -0.576 | -0.753 | -0.869 | -0.845 |
|
-N+P: Nitrogen starved in the presence of P-factor -N-P: Nitrogen starved in the absence of P-factor |