mcm3
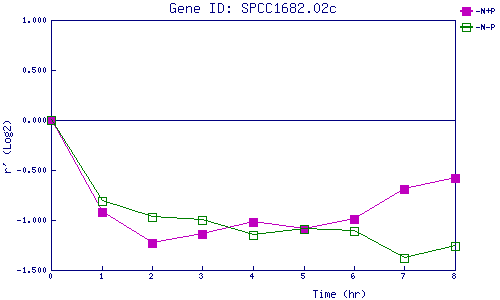
| 0 | 1 | 2 | 3 | 4 | 5 | 6 | 7 | 8 | |
| -N+P | 0.000 | -0.917 | -1.232 | -1.135 | -1.021 | -1.089 | -0.986 | -0.690 | -0.579 |
| -N-P | 0.000 | -0.809 | -0.966 | -0.997 | -1.146 | -1.086 | -1.108 | -1.380 | -1.256 |
|
-N+P: Nitrogen starved in the presence of P-factor -N-P: Nitrogen starved in the absence of P-factor |