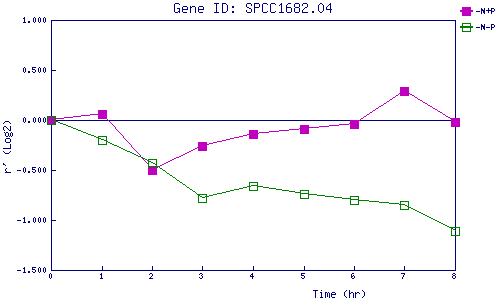
| 0 | 1 | 2 | 3 | 4 | 5 | 6 | 7 | 8 | |
| -N+P | 0.000 | 0.063 | -0.499 | -0.260 | -0.143 | -0.089 | -0.035 | 0.287 | -0.020 |
| -N-P | 0.000 | -0.200 | -0.427 | -0.781 | -0.658 | -0.744 | -0.798 | -0.853 | -1.107 |
|
-N+P: Nitrogen starved in the presence of P-factor -N-P: Nitrogen starved in the absence of P-factor |